Global Warming and Climate Change
Updated 31 January 2016
|
|
Global Warming and Climate Change Updated 31 January 2016 |
|
HOME PAGES GLOBAL WARMING WHAT YOU CAN DO GREEN ISSUES BACKGROUND THE INITIATIVE |
Greenhouse Gases, Global Warming and Climate Change This page gives an introduction to greenhouse gases in the atmosphere, global warming, and some of the possible consequences: melting ice, rising sea level, changing weather patterns, extreme and very variable weather, and ocean acidification. We explain possible confusion with the ozone layer. Finally, we introduce the important concept of a carbon budget and how much of it we have already used up. Some useful references are given at the end. A poster-style summary of the new IPCC 5th report on climate change, prepared for the Blewbury Green May Fair on 10 May 2014, is available here (pdf). Introduction * There is no doubt that the amount of carbon dioxide in the air is increasing, and there is nearly universal agreement among scientists that this will have significant effects on the climate. However, there are uncertainties about the magnitude of the effects and therefore what would be tolerable. 
The climate of the Earth results from a complex set of interactions, largely driven by the heat from the sun. Over geological time temperatures have varied, sometimes much warmer and sometimes much colder than now, while the composition of the atmosphere has also altered. Animals have adapted, moved, or become extinct. Very sudden changes in climate, some of which have been ascribed to the impact of enormous meteors or to vast volcanic eruptions, have been associated with widespread extinction. However, the last 4,000 years have been a period of relative stability, which is likely to end due to the impact of human ingenuity. The reason is that we are using fossil fuels to generate the energy needed to drive our inventions, including electricity, motor cars, aeroplanes, central heating, refrigeration, air conditioning, televisions, computers, and many others. This has increased the amount of carbon dioxide and other so-called greenhouse gases in the atmosphere. Other human activities, notably deforestation and making cement, add to the problem. Nowadays, the phrase global warming mainly refers specifically to the increase of average temperatures over the globe in recent years and what will happen in the future. The effects of global warming are best referred to as climate change, since there are other very serious effects, some of them not at all obvious, in addition to rising temperature. When scientists started to see evidence for global warming, in the last few decades of the 20th century, sceptics first questioned whether the temperature increase was real. As the evidence became undeniable, the sceptics instead tried to deny that the increase had been caused by human activity. Again, the evidence became more and more convincing. Human activity dumps tens of billions of tons of carbon dioxide and other greenhouse gases into the atmosphere every year, enough to increase the amounts of these gases significantly. These do warm the planet – that is a long-established scientific fact. Having seen many other effects of human activity changing the Earth, the question should perhaps be the other way around: ‘How can we add so much greenhouse gas into the atmosphere and not have a significant effect?’ * Global warming and the resulting climate change are unlikely to destroy human life on Earth. But it could have very serious effects on many places where people live, flooding communities and cities, causing severe heat and drought, and having devastating effects on food and water supplies. The disruption could lead to wars, poverty, disease, and nowhere to live for huge numbers of people. We are already beginning to see significant changes due to global warming. * The big question is whether we can act quickly and decisively enough to minimise the effects, or whether people will just look after their own short-term interests and problems so that the worst effects are allowed to happen. The role of carbon The chemical element carbon is the basis and key element for all life on the earth, due to the vast number of complex organic compounds it can form. Only a very small proportion of the world’s carbon is in the atmosphere, in the form of two of the most important greenhouse gases: carbon dioxide (CO2) and methane (CH4). Carbon is released into the atmosphere in several ways:
Carbon is also removed from the atmosphere in several ways:
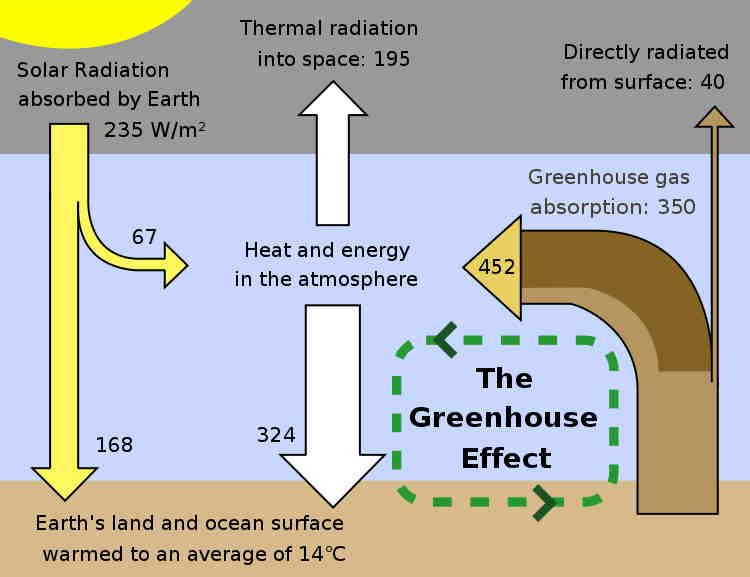
Greenhouse gases are so named because they have an effect on the Earth similar to that of the glass of a greenhouse. They let the sun’s visible rays in to warm the Earth, but they then absorb some of the infrared energy being radiated out again and radiate some of this back to Earth. This is illustrated in the diagram. The average temperature at the Earth’s surface is about 14°C. The existence of some greenhouse gas in the atmosphere is essential for this. If there were none at all the climate would be very much colder, an average of about –18°C (the temperature inside a freezer). The Earth would be very different: water would be frozen, and without carbon dioxide in the atmosphere trees and plants could not grow. The main greenhouse gases whose abundance has been increased due to human activity are carbon dioxide, methane, nitrous oxide, and fluorocarbons such as CFCs. Of these, carbon dioxide is by far the most abundant but other gases have much greater effect at a given concentration. Water vapour is also a very important greenhouse gas. Since 1750 the concentration of carbon dioxide in the atmosphere has increased by about 45%. The amount of methane has increased by over 150%, nitrous oxide by about 20%, and all the fluorocarbons are new. At present, carbon dioxide produces about two-thirds of the overall global warming effect produced by the various greenhouse gases. The two graphs below at the left show the increases in carbon dioxide in the atmosphere over the past 800,000 years, and since 1700 (the beginning of the industrial revolution). Note the unprecedented sharp rise since the middle of the 20th century. The three graphs at the right show the recent increases in three of the main greenhouse gases: carbon dioxide, methane and nitrous oxide. The effect of greenhouse gases is usually expressed in terms of carbon dioxide equivalent, in order to make comparisons easier and to give overall figures. The source of these increases is almost entirely human activity. 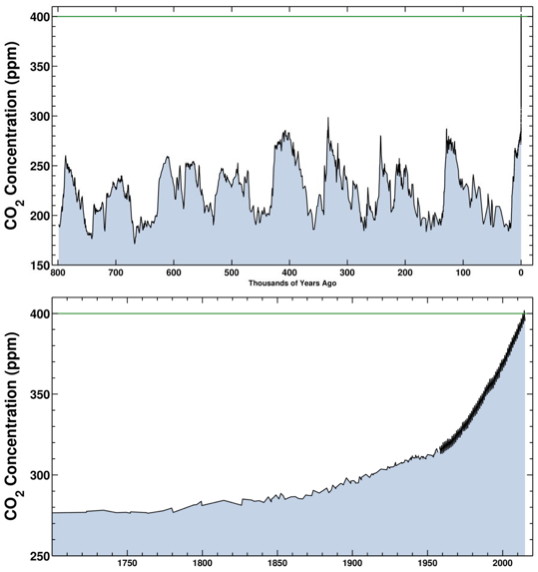
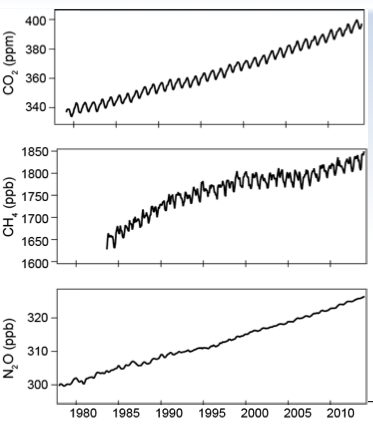
Record levels in the atmosphere Before the industrial revolution, carbon dioxide in the atmosphere was at the level of 280 parts per million (ppm). In 1958, when very accurate readings began, it was 318 ppm. But in May 2013, carbon dioxide in the atmosphere briefly measured 400 parts per million in the atmosphere for the first time in the modern era. In the spring of 2014, following normal seasonal variation, levels remained above 400 ppm throughout April, May and June. In 2015 it had already surpassed 400 ppm in February, rose to 403.7 ppm in May, and remained above 400 ppm through July and into August. The level is now higher than it’s been for about 4 million years, when the Earth’s climate was much warmer than it is now: the Arctic was ice-free, savannah spread across the Sahara, and sea level was up to 40 metres higher. Conditions like this, plus much more extreme weather – heatwaves, violent storms, floods, droughts – are what we can expect if we don’t take effective measures to reduce atmospheric greenhouse gases 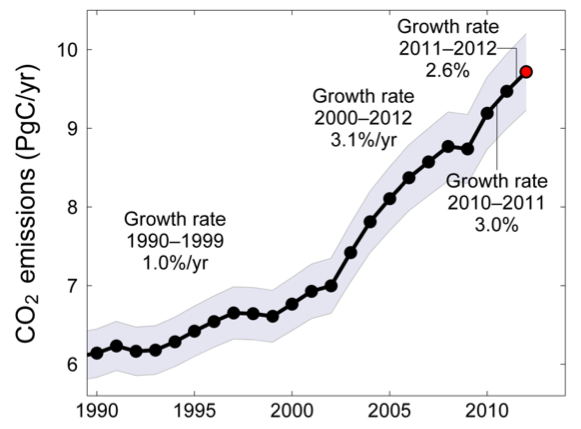
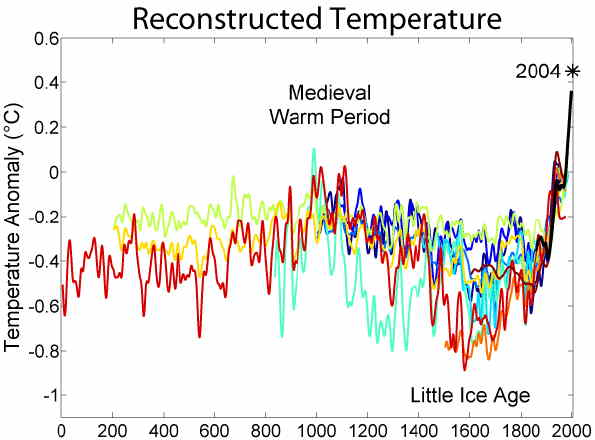
Emissions are still increasing Despite efforts to reduce emissions of carbon dioxide from fossil-fuel burning and cement making, so far there has not been a reduction – far from it! In the late 1950s the carbon dioxide level was increasing by about 0.7 ppm per year, but that increased to about 2–3 ppm per year. More recently, as the graph shows, from 1990 to 1999 the average annual increase in emissions was about 1% per year, but in the years since the millennium annual missions have been rising at more than double that rate. However, in 2014 emissions were the same as in 2013 – we don’t know yet whether that was that a hopeful sign, or just a glitch. Does this have anything to do with the ozone layer? No! People often confuse the effects of greenhouse gases such as carbon dioxide, which are spread throughout the atmosphere, with the ozone layer because it too has been in the news in recent years. The ozone layer is located far up in the Earth’s atmosphere and contains relatively high concentrations of ozone (O3), which is a form of oxygen. This ozone absorbs most of the sun’s ultraviolet light, which otherwise would be very harmful to life on earth. It was in the news because fluorine compounds known as chlorofluorocarbons (CFCs), which were widely used in refrigerators, air conditioners, aerosol sprays and industrial cleaning, were found to be destroying the ozone layer, most obviously by producing a big hole in it over Antarctica. Under a very successful international treaty called the Montreal Protocol, use of the most damaging chlorofluorocarbons began to be phased out in 1987 and was banned in 1996. The ozone layer now seems to be recovering, but only gradually. Effects of Increased Greenhouse Gases Rise in average temperature The climate of the Earth is a result of so many different complex interactions that it is difficult to predict exactly what the effect of adding greenhouse gases to the atmosphere will be on the climate in different regions. However, computer climate models have become much more realistic and sophisticated, reproducing past and present behaviour more and more accurately. Virtually all scientists studying the problem agree that the effect will be an increase in average temperatures. This is already happening – the left-hand graph below indicates that the Earth is now warmer than at any time for thousands of years. The right-hand graph below zooms in on recent years, for which we have more accurate records. There has been a significant rise of about 0.8°C in average temperatures over the last century. Although this may not sound like a very big rise, it has already had very clear effects that will be mentioned below. In the 20th century the rise was interrupted from about 1950 to 1980, and this is believed to be due to variations in the energy output of the sun and as well as ash from volcanoes. Due to local fluctuations in weather, global warming does not occur around the world in a uniform way. For example, despite the very cold winter weather in north-western Europe in the winters of 2009–10 and 2010–11, 2010 was one of the warmest years since global temperature records began in 1850. Depending on how the data were analysed, 2014 was either the warmest year on record or tied with 2010 and 2005. Some parts of the globe were exceptionally hot, with many experiencing their warmest year ever. 2015 was warmer still and now holds the record. Different ways of looking at how recent years compare with a century and a half of record-keeping include:
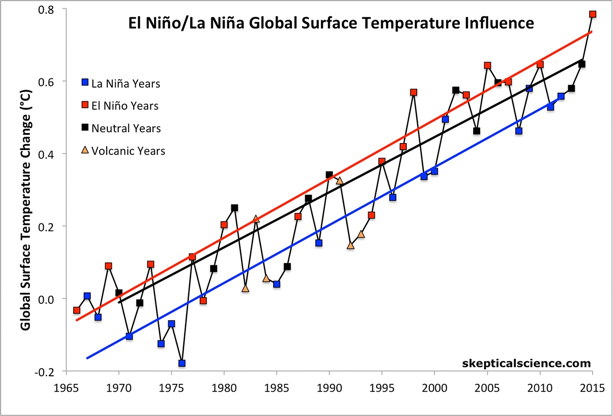
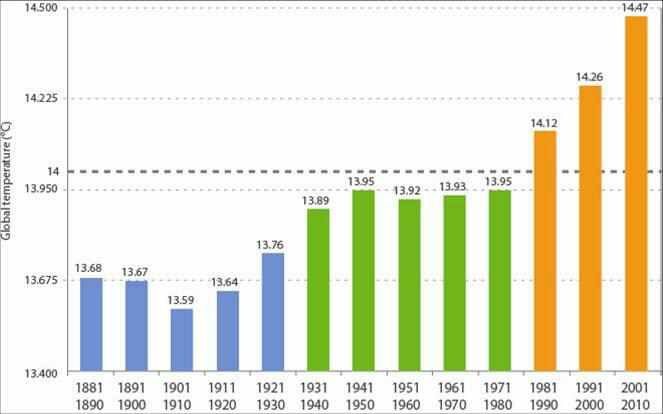
It is important to realise that global warming does not mean that each year will always be warmer than the previous year. This can be seen clearly in the right-hand graph above. The reason is that there are also short-term world-wide climate fluctuations on top of the overall warming trend. The best-known of these is due to temperature changes in the surface waters of the tropical eastern Pacific Ocean. One phase is called El Niño (warm, the years shown in red) and the other phase is La Niña (cold, the years shown in blue); in many years the situation is neither. In 2015 we entered a strong El Niño phase. In addition to causing some years to be unusually warm or cold, El Niño and La Niña are associated with floods, droughts, and other weather disturbances around the world. Although El Niño itself is not due to global warming, it may be getting more severe due to it. There is a full discussion of El Niño and some clear diagrams in Wikipedia. Other ‘oscillation’ effects, notably in the North Atlantic, must still be fully understood; in some cases they may even lead to as much as a decade or more of apparent cooling. In terms of global warming, all of these other effects mean that what is important is the long-term trend, not whether one specific year or a few years in a row are unusually cold or hot Nevertheless, in the past few years the rise in global average surface temperatures seemed to level off, leading to some people claiming that climate change has stopped or at least paused. But many other indicators showed that this is due to natural variability of the weather, plus more volcanoes erupting than usual. Most importantly, more of the added heat has gone into the oceans – see the left-hand graph below showing rising heat content in two different depth ranges – and this will soon have a big effect on the surface temperature. With 2014 showing strong warming and 2015 the warmest year ever it begins to look like the ‘pause’ is over. A very clear account of the global climate in the decade from 2001 to 2010 (World Meteorological Organisation – available here) describes the warmest decade of the modern era, extreme weather and decreasing ice cover. Although many of these events and trends can be explained by the natural variability of the climate system, it is clear that rising atmospheric concentrations of greenhouse gases are also affecting the climate. The year-to-year fluctuations can be ‘ironed out’ by showing the temperature averaged over decades, and the rising average temperature is shown clearly by bar chart below at the right taken from the report. 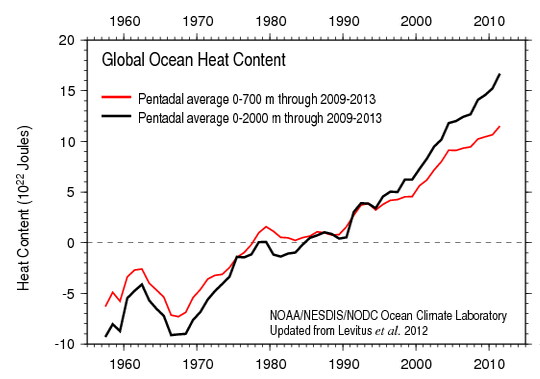
The overall rise in temperature is the easiest effect to predict, and the predictions of average global temperature made by the Intergovernmental Panel on Climate Change back in 1991 have been borne out. No study which ignores the effect of the increase in greenhouse gases has predicted or explained the sharp rise in temperatures since the late 20th century. Some of the rise in temperature may be caused by other effects than greenhouse gases – for example ‘black carbon’ (i.e. soot), changes in the sun, long term cyclic changes in the Earth’s orbit, or the effect of cosmic rays on cloud cover. However, none of these alternative explanations for the rise in temperatures comes anywhere close to explaining it fully. Estimates of the size of the rise in the future cover a wide range, and depend strongly on the level of future greenhouse gas emissions. The effects will also be different in different parts of the world. A rise of 2–3°C, now seen as optimistic, would cause a larger climate change than the Earth has experienced for at least 10,000 years. Possible consequences of increased temperatures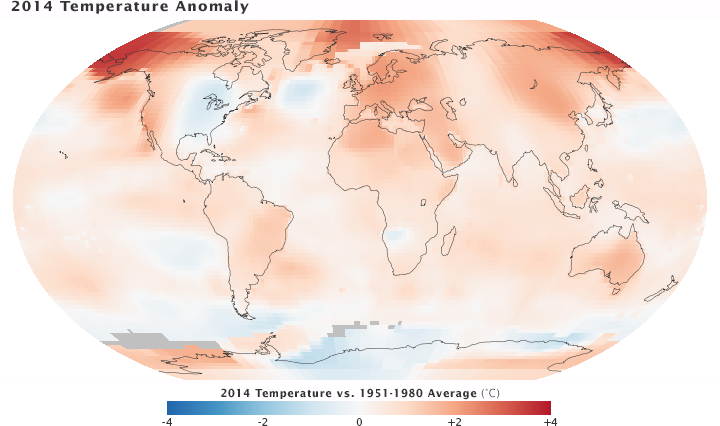
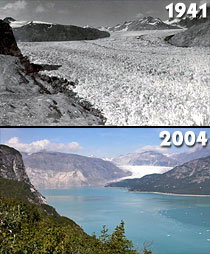
Even relatively small changes in climate and the environment can cause serious disruption to the way we live. A rise of 3°C in global average global temperature over the 21st century would have a pace and impact that would be difficult for people and ecosystems to adapt to. If the rise in temperature can be limited to 3°C or less, predictions are that some regions will benefit from the warmer climate while others will suffer. Some cooler regions (northern Canada, for example) may experience longer growing seasons for crops, and yields might be further boosted by the fertilising effect of having more carbon dioxide in the atmosphere. But many other regions would suffer badly. Total global crop yields are expected to fall, and this would cause many problems. If the rise is more than 3°C then it is predicted that virtually all regions will either be worse off or will suffer due to the regions that are worse off. However, it is important to realise that the temperature rise is not predicted to be uniform. It would be much higher than average in some regions – which will therefore suffer more serious effects – and lower in others. This is already apparent. For example, in 2014 we can see in the figure at right that in the Arctic the rise (‘anomaly’) compared to the mid-20th century average (1951–1980) was several degrees, while in a few other places it even got very slightly cooler. The rise in the Arctic has affected the stability of the jet stream; we discuss the resulting extreme weather below. Severe heat waves and droughts (already occurring in some recent summers), storms and flooding (see below) will all be much more frequent. Many of the world’s hotter areas will become even less tolerable to live in. Areas that now grow large fractions of the world’s staple foods, such as the American mid-west, may become arid semi-deserts. In some places, such as central Spain, a rise of average temperature of up to 7°C is predicted. These effects, and others described below, will tend to affect poorer countries disproportionately, and therefore fall on populations who are the least able to adapt, especially in terms of health, and of access to food and clean water. Ecosystems will not always be able to adapt to the changes, and the result would be large numbers of species becoming extinct and loss of biodiversity. For example, the southern part of the Arctic region has seen a temperature rise of 1°C to 3°C over the past 50 years, far more than the global average of 0.8°C. Canada, Alaska and Russia are experiencing initial melting of permafrost. This disrupts ecosystems, and by increasing bacterial activity in the soil could lead to these areas becoming carbon sources instead of carbon sinks by emitting large amounts of methane, thus accelerating global warming. In order to limit the effects of climate change, the internationally stated goal is to try to keep the global temperature rise to less than 2°C. However, the continuing rise in emissions (see above), combined with evidence that the effects such as melting ice (which leads to feedback effects) are greater than predicted, have led an increasing number of experts to believe that limiting the temperature rise to 2°C may no longer be possible. Melting ice is another serious, and widely publicised, effect. Pictures of glaciers in mountainous regions as they are now compared with only a few decades ago show dramatic shrinkage (photos at right), and everyone has seen images of polar bears on small pieces of melting ice surrounded by open water. Consequences of melting mountain glaciers Mountain glaciers in the Andes, Alps, Pyrenees, Himalayas, Rocky Mountains and other areas have decreased in area by about 50% in the past century. Since 1980 the retreat of ice has sped up, and it has increased even more since 1995. For example, a glacier in Alaska is shown in the photos. The melting can cause landslides and flash floods, but the most serious effect for people living in the valleys of glacially fed rivers is that the water flow could be greatly reduced during much more of the year. Glaciers store snowfall from winter and from earlier years of high precipitation, and provide water in summer that is used for drinking and irrigation of crops. For example, the region of the Himalayas and Hindu Kush feeds Asia’s biggest rivers: the Ganges, Indus, Brahmaputra, Yangtze, Mekong and Yellow. Spring floods followed by droughts could affect 2.4 billion people living in India, China, Pakistan, Bangladesh, Nepal and Myanmar. This would affect water supplies and farming, and the resulting disruption could have very serious social and political consequences. On a larger scale, we are seeing unexpectedly huge and increasing losses of sea ice in the Arctic. The ice cover at the summer minimum has changed dramatically. This is because the thickness of the ice has decreased by more than half since the middle of the 20th century, and there is now far less ‘multi-year’ ice that survives the summer than there used to be. In 2007 the summer minimum ice cover was only 60% of the 1979–2000 average minimum. This was the record low until 2012’s far greater ice melt, down to less than 50% of the 1979–2000 average cover despite the summer not being particularly warm in the Arctic. The map below, centred on the North Pole, shows the 1979–2000 average as an orange line, with the 2012 record in white. The graph shows the record summer ice melts of 2007 and 2012. Although the summer minima in 2013, 2014 and 2015 were not as low as in 2012, the nine summers with the lowest minimum sea ice extents have all occurred in the past nine years. New records were set in 2002, 2005, 2007 and 2012. 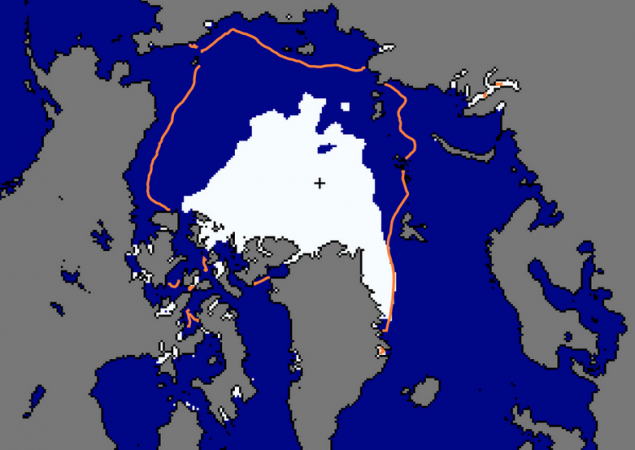
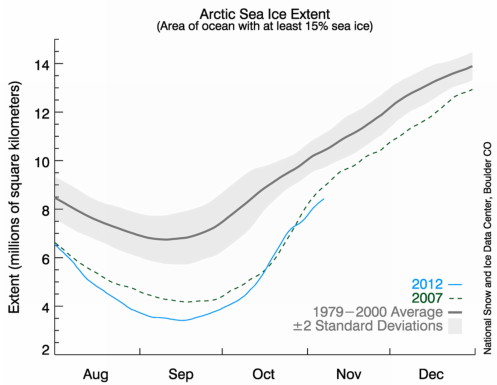
However, the much smaller area of summer ice coverage does not reveal the full significance of what is happening. Because the remaining ice is also much thinner, the total volume of ice at the 2012 minimum was only about a quarter of the 1979–2000 average, so it may be that we are not half-way but three-quarters of the way to ice-free summers in the Arctic. For some time it has been expected that there might be no late-summer ice cover at all in the Arctic by the end of the 21st century, but recent predictions are that this might happen within the next ten or twenty years. In September 2007, Arctic sea ice retreated sufficiently to allow the fabled Northwest Passage to become navigable to shipping for the first time in recorded history, and in summer ships now regularly sail around the northern coast of Russia. Opening up of the Arctic has also started a rush for oil and other mineral resources, which raises many serious environmental concerns. Measurements of the ice volume at the peak of winter give a similar message: the peak ice volume is now roughly half of what it was 30 years ago. Note that the melting of Arctic sea ice does not raise sea levels in a direct way because the ice is already floating in the ocean. The loss of Arctic sea-ice cover itself causes global warming to speed up. The reason is that ice reflects most of the sun’s rays back into space, while open ocean or exposed land absorbs much more of the sunlight and converts it to heat, warming the Earth further. Partly due to this, the Arctic is warming roughly twice as fast as the rest of the northern hemisphere and already seems to be causing some extreme and very variable weather. This sort of effect, in which the effects of warming cause even more warming, is called feedback. A wide variety of other possible feedback effects are being studied, for example:
At present we simply do not know enough to predict accurately how much feedback effects like these will worsen the situation, but some of the possible effects might be extremely serious due to exceeding levels that trigger big changes. Antarctic ice Unlike the Arctic, where there has been a very big temperature rise, the temperature rise in Antarctica due to global warming has been very small. In the Antarctic there has been significant melting of the West Antarctic ice sheet and ice on the Antarctic Peninsula, but not of the main bulk of the Antarctic ice. In fact, ice cover was actually at its largest recorded extent in 1979. However, recent observations seem to indicate that this may be changing. Melting of either the Greenland and Antarctic ice sheets would cause very big rises in sea level, and this is discussed below. 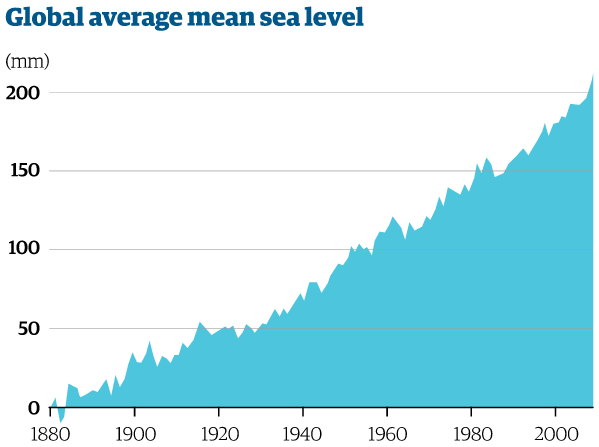
Increasing global temperature causes a rise in sea level, even without considering melting of polar ice, because water warmer than 4°C expands as it increases in temperature. Although the water deep in the ocean is at about 4°C, the upper levels of the sea are at higher temperatures, and so the water will expand if it becomes warmer. Sea levels will rise further if the Greenland or Antarctic ice caps melt. Since 1900 sea level has risen by an average of about 1.7 mm per year, but since 1993 this has increased to about 3 mm per year. A prediction by the Intergovernmental Panel on Climate Change for the year 2100 is a rise of 45 to 75 cm above levels in 2000 depending on what happens to carbon emissions, but other predictions that predict more melting of Greenland and Antarctic ice are considerably higher. Sea level rise is not uniform – some areas would see more and others less. A rise of even 20 cm in the global average sea level is serious for low-lying countries such as Bangladesh and Vietnam, many islands, and for very low-lying coastal cities such as New Orleans. Coupled with more violent storms, many other coastal cities such as London and New York could also suffer from severe flooding. (The Thames Barrier is being used much more often than a few years ago, most notably in the record wet winter of 2014.) Other coastal regions would also suffer, due to breaches in sea defences and the sea level rise. Increased melting of Greenland and Antarctic ice 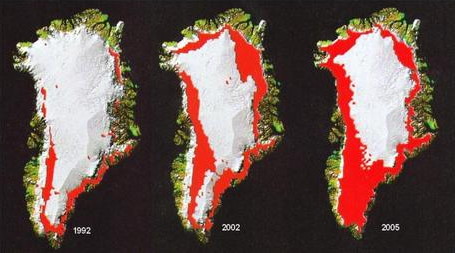
Greenland – About 99% of all glacial ice is in the ice sheets of Greenland and Antarctica. The ice in Greenland is retreating and thinning, more rapidly since about 2000. The loss of ice mass each year in Greenland is now about five times what it was in 1992. A major effect is to contribute to rising sea levels. If the average temperature in Greenland rises by 3°C, then the entire Greenland ice sheet might eventually melt. This would produce a far more serious rise in sea level of about 7 metres, which would inundate low-lying coastlines, islands, and river deltas. Predictions said that this would take many centuries, but the accelerating rate of melting has led to concerns that it may happen much sooner. The figure shows the extent of the surface melting of the Greenland ice cap in summer in 1992, 2002 and 2007; in 2012 most of Greenland showed surface melting. Antarctic – The main bulk of Antarctic ice, in East Antarctica, has been increasing due to a rise in snowfall. An analysis by the Scientific Committee on Antarctic Research (SCAR) says that Antarctic warming has been slowed down by the effect on climate of the ozone hole, but this is ending now that the main chemicals causing the ozone hole have been banned. However, the West Antarctic and Antarctic Peninsula ice sheets are already melting, and a recent study shows that over all Antarctica is losing ice. This is contributing to rising sea levels. In addition, a controversial recent paper predicts that at atmospheric carbon dioxide levels that are expected within a few decades (roughly 450 parts per million) the Antarctic ice sheet may start to disappear. Until recently it was believed that a limit of 450 parts per million would not cause such a catastrophic effect. The new prediction, based on geological history, continues by saying that if we do not get the carbon dioxide level back down to below the present level (which is about 400 parts per million, and rising by about 2 parts per million each year) quite soon after reaching the higher level, the Antarctic ice will be completely and permanently lost. This would raise sea levels by perhaps 70 metres, which would be catastrophic for human civilisation. (To illustrate the extent of the effect, note that Blewbury is about 70 metres above the present sea level.) Changes in weather patterns and precipitation 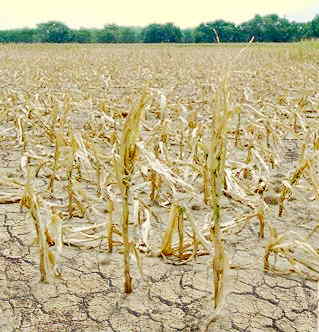
Predicted changes to the amount and pattern of precipitation would leave some areas that now have abundant rainfall much drier, while some arid regions would get more rain. A prediction for northern Europe, including the UK, is for wetter winters and hotter, drier summers. The Middle East, sub-Saharan Africa and China could lose significant rainfall, while other locations would see more. The recent, very long droughts in Australia and California might have been due to climate change. Predicted increases in extreme weather (see next section) are not limited to the tropics, although the most disruption and damage is likely to be from tropical storms in poor countries with high population densities in coastal regions and low-quality housing. Very severe storms, or long periods with intense rainfall, cause flooding. Global warming increases the likelihood of this happening. Flooding not only causes damage, but can also lead to epidemics of infectious diseases. High winds from severe storms damage buildings and other structures that were only built to withstand milder conditions. Changes in precipitation would have a serious effect on food supplies. For example, Stephen Mwakifwamba, national co-ordinator of the Centre for Energy, Environment, Science and Technology in Tanzania, has said that this is already happening: ‘In the past, we had a drought about every 10 years. Now we just don’t know when they will come. They are more frequent, but then so are floods. The climate is far less predictable. We might have floods in May or droughts every three years. Upland areas, which were never affected by mosquitoes, now are. Water levels are decreasing every day. The rains come at the wrong time for farmers and it is leading to many problems.’ Drought, desertification and overpopulation can cause severe problems, as populations move in the search for water and come into conflict with other people. In the future, coastal flooding and agricultural disruption may lead to hundreds of millions of environmental refugees. Extreme and very variable weather One effect of climate change is, not surprisingly, more severe heatwaves, such as in western Europe in 2003 (possibly the worst heatwave there in 500 years) and Russia in 2010. In 2012 the central US had its hottest summer ever (starting with an extraordinary blast in the north-central US in March), and the worst drought in half a century; this caused huge damage to food crops, leading to high prices with worldwide effects. Australia experienced its hottest year ever in 2013, and Argentina its second-hottest year. Some of these spells of very hot, dry weather have led to extensive wildfires. A less obvious prediction of climate change is for other kinds of extreme weather, and wide variations from normal patterns. However, it is important to remember that weather has a huge range of natural variability, and it is not possible to say that any one instance of highly unusual weather was directly caused by climate change. What’s affected is how often unusual weather occurs as well as how extreme it is. Studies do show wider variations in recent weather than in the past, and many (but not all) recent extreme examples seem likely to have links to global warming. One effect, which has fooled some people into thinking global warming may not be real, is unusual cold spells. These include the cold and snowy UK in the winters of 2009–10 and 2010–11, snow in southern Europe and north Africa in 2012, and the arctic US winter of 2013–14. 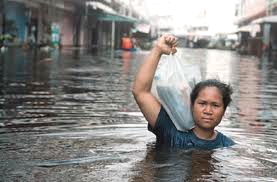
A very serious prediction is more frequent and extreme violent storms. Some well-known examples, chosen from a long list, include: Hurricane Katrina, which devastated New Orleans and the surrounding area in the US in 2005; hurricane Sandy, which caused vast damage to the New York/New Jersey area in 2012; and Typhoon Haiyan in the Philippines in 2013 – probably the most violent tropical storm on record. Long periods of excessive rain and resulting flooding are also predicted. In the UK there is certainly more heavy rain than in the past. Think of the UK floods in 2007, the coldest and wettest spring on record in 2012, the wettest winter on record in 2013–14 and the Christmas/New Year flooding of 2015–16. There are many examples elsewhere, such as the terrible floods in both Pakistan and Thailand in 2010 and 2011, and devastating floods in central Europe in 2013. The reasons for these effects are that warm air holds more moisture than cooler air, making heavier rain and flooding more likely. When water vapour in the atmosphere condenses to become rain it releases latent heat, so more atmospheric water can provide more energy to drive winds in violent rainstorms. In addition, due to tropical oceans being warmer hurricanes and other tropical storms can pick up more energy and so become more powerful. There is already some evidence for increasing numbers of category 4 and 5 hurricanes, although the evidence is not yet totally convincing. Weakening of the north polar jet stream The north and south polar jet streams are high-speed winds that circle the globe high up in the atmosphere. They separate cold weather near the poles from warmer weather towards the equator. The jet streams are driven by the temperature difference between the warm tropics and cold polar regions. Some of the extreme, and less obvious, effects of global warming on climate seem to be due to the north polar jet stream. 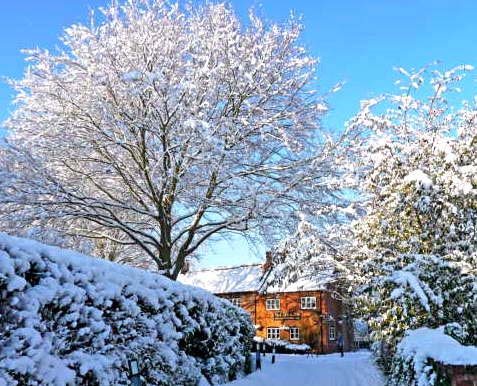
The Arctic is warming faster than elsewhere, so the temperature difference driving the north polar jet stream has decreased. This weakens the jet stream and makes it more likely to meander, moving weather patterns further north or south than usual. Sometimes meanders break off, so that instead of moving on and changing, weather patterns get trapped in one place and persist – this is called a ‘blocking pattern’. The trapped weather can be either a low-pressure region (so you soak, e.g. the UK’s wet, cold spring in 2012) or a high-pressure region (so you roast). In the autumn and winter 2013–14 north-west Europe had unusually warm and very wet weather (e.g. daffodils in Norway in November) while the US had extremely cold weather: these strikingly different effects were due to the same jet stream anomaly. Recent cold, snowy winters in the UK Two recent winters have been very cold and snowy in north-western Europe: 2009–10 for example was the coldest for three decades in the UK, and December 2010 was one of the coldest Decembers ever in the UK. (The photo shows Blewbury in January 2010.) These two winters misled many people to conclude that global warming had slowed down or stopped, but that is not correct. Global warming is based on the average over the entire planet, and despite our cold winters 2009 and 2010 were globally two of the warmest years of recent times. For example, while northern Europe was having the very cold weather, Vancouver’s 2010 Winter Olympics were suffering from the warmest winter on record there. The important distinction to make is between short-term local weather and long-term global climate. What happened in our two recent cold winters was that the north polar jet stream developed a large, persistent kink to the south over the north-eastern Atlantic. This blocked warm winds from the west, and so our weather tended to be dominated by cold winds from Siberia while North America was relatively warm. As explained above, the explanation may be due to weakening of the jet stream because the Arctic has warmed more than the temperate zone. 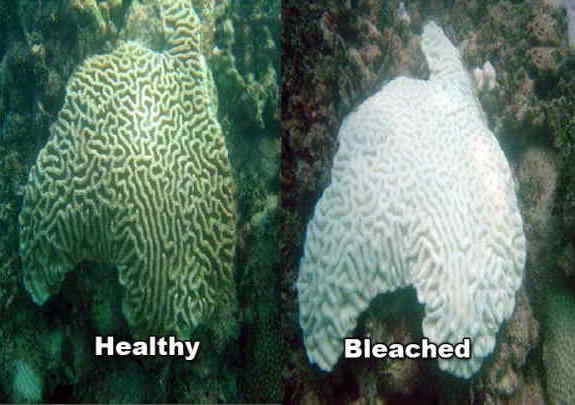
A less frequently discussed but very serious effect is acidification of the oceans. As the amount of carbon dioxide in the atmosphere increases, so does the amount dissolved in the oceans. This reacts with the water to produce carbonic acid, which makes the oceans more acid. There is already evidence of a small change in pH (which measures acidity) of seawater from 8.3 to 8.2, and predicted carbon dioxide emissions by 2100 might reduce the pH by a further 0.5 to 7.7. This is probably a lower pH than has been seen for hundreds of millennia. The increasing acidification could have a serious effect on corals, which are already in trouble in many places due to increasing water temperatures. Possibly even more serious is the effect the increased acidity might have on marine organisms with shells, which are made of calcium carbonate and would tend to dissolve. This could have major effects on the entire marine ecosystem. Some of the geo-engineering proposals to reduce the effects of climate change would work by blocking some of the sun’s light. They would not reduce the amount of carbon dioxide in the atmosphere, so would do nothing to reverse increasing ocean acidification. Currents of warm water near the surface of the ocean transport heat from tropical regions northwards, and deeper currents of cold water flow from the north to the tropics. This large-scale circulation, due to differences in temperature and salinity, is known as the thermohaline circulation. The best-known segment is the Gulf Stream, which helps keep north-western Europe much warmer than would otherwise be expected for its latitude. The Gulf Stream is driven by dense, cold, salty water sinking at the northern end. Global warming causes more ice in the Arctic to melt, and this would add a lot of less dense fresh water to this flow. There are worries that this could slow or even stop the circulation system. This seems to have happened in the past, triggered quite suddenly. The consequences of losing the Gulf Stream would include colder and more violent weather over much of northern Europe. So far, evidence that this might already be happening is unclear, and if it is happening the pace seems to be slower than some people initially feared. For the long term we do not know yet how serious the threat is. The global carbon budget: how much greenhouse gas can we emit? If we want to reduce the effects of global warming we need to drastically reduce the amount of the carbon dioxide and other greenhouse gases that we emit. But how much reduction is needed? The answer is that the target for net greenhouse gas emissions must be zero. This means that any remaining emissions will have to be balanced by removing an equivalent amount of greenhouse gas from the atmosphere. What if all emissions stopped now? Suppose that we could miraculously stop all emissions of greenhouse gases tomorrow. Would that stop further global warming? The answer is no. Carbon dioxide emitted to the atmosphere produces only some of its warming effects immediately – the rest of the warming it causes takes many years to happen. That is because it takes a long time for the oceans to warm up and for ice sheets to melt. So even if this ‘miracle’ were to happen tomorrow, there would be a continuing temperature rise over a century or more and a sea level rise for several centuries. To make matters worse, carbon dioxide emitted by human activity remains in the atmosphere for hundreds or thousands of years. Other greenhouse gases, such as methane, disappear more quickly, but most of the current problem is due to carbon dioxide. Carbon budget Since carbon dioxide in particular persists in the atmosphere for centuries, our continuing carbon emissions simply add to the total amount in the atmosphere. The temperature rise produced is determined by the cumulative total amount of carbon dioxide, not the rate at which we emit it. If we keep adding more carbon dioxide the temperature will keep on going up. The best we can do is to reduce emissions to zero – that would eventually stabilise the rising temperature, but not reduce it. The internationally agreed target is to try to limit the warming to 2°C. Even 2°C will have very serious effects – we are already seeing harmful changes with a rise of only 0.8°C, and things will get worse as the carbon dioxide already emitted continues to cause more warming. In order to limit the warming to 2°C (already considered by many experts to be an unrealistic goal) the total amount of carbon dioxide-equivalent greenhouse gas in the atmosphere has to be kept below a certain limit. That limit has been estimated, and so has the amount we have already emitted. By simple arithmetic we can therefore estimate how much more we can emit. 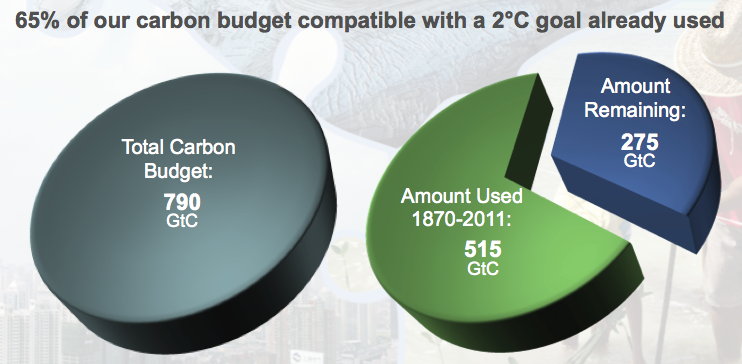
The figure at the right illustrates this. The carbon budget for a 2°C rise is estimated to be about 790 gigatons of carbon* added to the atmosphere since the industrial revolution. At the end of 2011 we had already emitted about 515 gigatons, mainly by burning fossil fuels. That meant nearly two-thirds of our carbon emissions budget was already used up! If we were to keep our emissions steady at the current rate (which in reality is still rising!) of around 10 gigatons per year, then starting from 2011 there would be only about 27 years, i.e. 2038, before we hit the limit and must immediately stop emitting carbon. That is of course not a realistic scenario, but it indicates the scale of the challenge. These estimates are not precise, in fact some estimates are more pessimistic, but the overall message is clear. The amount of carbon dioxide that could be added to the atmosphere for a temperature rise of 2°C would produce a carbon dioxide level of about 450 parts per million; the current figure is about 400 ppm. The sea level rise at the end of stabilising the temperature at this value would ultimately (after hundreds of years) be about 2–3 metres. * A gigaton of carbon (GtC) is a billion tons. This measures just the carbon in carbon dioxide; a ton of carbon dioxide contains 0.273 tons of carbon. The scale of the challenge The IPCC’s new fifth report suggests that to limit the temperature rise to 2°C our carbon emissions should be reduced to zero by 2100. But we need to start seriously reducing our still-rising emissions as soon as possible. Prof. Chris Rapley of UCL (former Director of the British Antarctic Survey and of the Science Museum) said in 2015: ‘If we leave it until 2020 – only five years away – the subsequent reductions would be of the order of 6% per year to stay within the 2°C limit. 6% may not sound much, but annual reductions of carbon emissions greater than 1% have happened only during economic recession or upheaval. ... to achieve the necessary reduction in carbon emissions will require the invention and mass roll-out of new technologies that do not exist yet. ... The 6% annual rate of reduction required is global. We in the developed world have to reduce emissions even more rapidly to accommodate growth in the developing world. To achieve the necessary reduction will require a collaborative effort on a global scale.’ If we cannot reach zero because some emissions can’t be eliminated then we must find ways to remove carbon dioxide and other greenhouse gases from the atmosphere, and these measures must not create other problems. An example of this might be Bio-Energy Carbon Capture and Storage (BECCS). This combines growing crops for biofuel and capturing the carbon emitted when it is burned. However, this is so far unproven, and growing of crops for biofuel has already raised issues of food security. An important message is that proven reserves of fossil fuels already amount to about between three and seven times more than our remaining budget, and unproven reserves are several times larger than that. The conclusion is stark: there are vastly more fossil fuel reserves than the world can use safely. Therefore, most of the known reserves of coal, oil and gas must remain in the ground unless we can find a way to capture and store the carbon dioxide generated when it is burned. But progress on that has been painfully slow, and it is hard to see how it could be done in a way that eliminates most carbon emissions. Wikipedia has comprehensive articles on the greenhouse effect, global warming and its effects, among many others. The Intergovernmental Panel on Climate Change (IPCC) provides a variety of authoritative and comprehensive reports. The Royal Society has much useful information and some important statements. The Met Office has a climate guide explaining climate science, climate change and their own research. The US Environmental Protection Agency provides summaries of the current state of scientific thinking. The US National Oceanic and Atmospheric Administration runs the very informative climate.gov website. The US Energy Information Administration has energy statistics covering the world in some detail. The American Institute of Physics has a comprehensive website on how climate change was discovered, and many useful links and references. RealClimate, run by climate scientists, has a wealth of information. Its start here section has good articles rebutting the arguments of sceptics. Skeptical Science explains climate change science and rebuts global warming misinformation. National Geographic’s website has some very interesting and dramatic interactive displays and videos. |
 |
If you have any comments or queries about this website please contact the
webmaster. |
© Blewbury Energy Initiative 2016 |