|
HOME PAGES
Blewbury
Sustainable Blewbury
Energy Initiative
GLOBAL WARMING
Greenhouse gases
Consequences
Global warming
references
Links to other sites
WHAT YOU CAN DO
Save energy
Reduce expense
Generate energy
Get domestic grants
Install low-energy lighting
Transport issues
Driving tips
Choosing a car
Transport emissions
Alternative road fuels
Hydrogen and fuel cells
Follow other energy advice
Saving energy
Monitoring
energy usage
Energy myths
GREEN ISSUES
Renewable energy
Offshore wind costs
Nuclear fission energy
Nuclear fusion energy
Storing the gases
Geo-engineering
BACKGROUND
Facts and figures
Energy assessment
THE INITIATIVE
News & diary of activities
Contacts and aims
Home energy questionnaire
Survey 2009
|
This page discusses the emissions from different forms of transport.
After the discussion of some general points, a table showing
estimated emissions per passenger mile is provided.
Some personal decisions that might be drawn from this table are listed, and
then the rest of the page describes how the estimates were derived and the problems in generating reasonable estimates.
Transport emissions
The estimation of the CO2 produced from different
transport options is inexact, and widely different figures can be produced by
varying the assumptions. However an average figure of 158 g/km CO2 for
cars in the UK is quoted. The following table is a reasonable estimate of the
relative impact of different forms of transport sorted in order of increasing
production of CO2 per person for the same distance travelled.
Emissions are given as CO2 per kilometre as this is the figure
quoted in the standard vehicle tests. For cars the table also includes the
official energy efficiency group, which in the UK is used to determine vehicle
licensing costs and the tax treatment of company cars. The assumptions behind
the data are described below.
The following issues should be considered in
reviewing this table:
- Consumption by a vehicle is only slightly affected by the number of people
carried. This table uses estimates of average loading, but if the vehicle
is taking twice as many passengers each passenger will be responsible for
half as much pollution.
- Electric vehicles appear to have a cost advantage which depends on the cost
of the electricity used to charge them. This is partly because they are typically
lower powered than petrol or diesel alternatives. However, the time needed
to recharge them and the necessary arrangements to do this are significant
disadvantages.
- For cars the table uses the average fuel consumption from the standard urban
and rural tests. Many people find that the fuel consumption in practice may
be 10–20% worse than this.
- The cars listed are all the latest models.
Older cars of the same type typically produce more CO2 per kilometre
- For the selected car models the table lists a diesel version with manual transmission when this option is available.
This typically has the lowest emissions for that vehicle type.
Where there are options the version with the lowest emissions has been chosen.
Petrol versions can be 20% worse, and automatic transmission may add another 5%.
- Diesel engines emit more of other pollutants than petrol,
notably nitrous oxide which is also a greenhouse gas, and
small particles that can cause respiratory problems and cancer –
new cars now have particulate filters to reduce this problem. New urban and rural
buses also have cleaner engines.
- The trains listed are those Blewbury residents may be most likely to use.
The IC225 on the east coast line typically has higher loading than the Great
Western high-speed trains. It is arguable that this is not relevant when using
the train on the relatively crowded route from Didcot to London, and more
relevant for travel to the west.
- The emissions by planes at high altitude are considered to be much more damaging
than the same emissions at ground level. In addition car journeys at either
end of the trip can add significantly to the CO2 emissions.
- Miles per gallon (mpg) are quoted using the imperial gallon as used in the
UK. The US gallon is 0.83 of this so to get mpg (US) multiply the mpg (imp.)
by 0.83.
- For an approximate conversion from miles per gallon to CO2 grams
per kilometre,
for petrol cars divide 6520 by mpg, and for diesel cars divide 7410 by mpg.
|
| Motorised bicycle | Electricity | | 3 | | 1 | 1 | | 3 |
| Coach | Diesel | 10 | 755 | | 50 | 30 | 300.0 | 25 |
| East coast main-line train IC225 | Electricity | | 7692 | | 536 | 268 | | 29 |
| Proposed UK high-speed train | Electricity | | 9840 | | 536 | 268 | | 37 |
| Nissan Leaf electric car | Electricity | | 70 | | 4 | 1.5 | | 47 |
| City bus | Diesel | 5 | 1510 | | 90 | 27 | 135.0 | 56 |
| Toyota Prius hybrid car | Petrol | 72.4 | 89 | A | 5 | 1.5 | 108.6 | 59 |
| VW Polo BlueMotion | Diesel | 83.1 | 89 | A | 5 | 1.5 | 124.7 | 59 |
| Motorbike 125cc | Petrol | 100 | 64 | | 1 | 1 | 100.0 | 64 |
| Scooter 50cc | Petrol | 100 | 64 | | 1 | 1 | 100.0 | 64 |
| London Underground (total usage) | Electricity | | | | | | | 69 |
| Great Western train HST 125 | Diesel | 0.5 | 15104 | | 500 | 200 | 100.0 | 76 |
| Honda Jazz 1.2 | Petrol | 53.3 | 125 | D | 5 | 1.5 | 80.0 | 83 |
| Renault Scenic people carrier dCI 86 | Diesel | 57.6 | 130 | E | 7 | 1.5 | 86.4 | 87 |
| Ford Mondeo 2.0 Duratorq (115 PS) | Diesel | 53.3 | 139 | F | 5 | 1.5 | 80.0 | 93 |
| Plane 10,000 km A380 | Kerosene | 0.2 | 39487 | | 555 | 400 | 72.0 | 99 |
| Honda CRV 4x4 ES | Diesel | 43.5 | 173 | H | 5 | 1.5 | 65.2 | 115 |
| Plane 1000 km | Kerosene | | | | | | 60.0 | 118 |
| Motorbike 500cc | Petrol | 50 | 128 | | 1 | 1 | 50.0 | 128 |
| Rural bus | Diesel | 10 | 755 | | | 5 | 50.0 | 151 |
| Land Rover Discovery 4x4 3 2.7 | Diesel | 30.7 | 244 | L | 5 | 1.5 | 46.0 | 163 |
| Rural taxi – Mercedes E220 | Diesel | 47.9 | 156 | H | 5 | 0.75 | 35.9 | 208 |
| Cruise liner |
Fuel oil | 0.025 | 339200 | | 2000 | 1600 | 40.0 | 212 |
It is normally sensible to consider emission figures per person even for public transport,
as, for example, increasing use of a
train service is likely to lead in time to more trains. The exception is when a service, such as the buses through Blewbury,
is provided for social rather than for economic reasons. In this case extra passengers are not likely to lead to the introduction
of more buses.
Personal decisions based on this table
The following choices can be justified by consideration of the above table:
- Walk or cycle when possible.
- If public transport is provided for social reasons and is not overcrowded, use it if possible.
- Use public transport in cities, cars are relatively inefficient and polluting.
- If using a car, share it if possible.
- Large cars, powerful motorbikes and cruising are all generators of large amounts of CO2.
- Plane journeys encourage longer distance travelling, their
pollution in the upper atmosphere is particularly damaging, and
many trips incur long car journeys at each end.
High-speed train travel in France is claimed to produce
very little CO2, as the power used comes mainly from nuclear power
stations. This also applies to much of the journey of the Eurostar, and is
the reason why Eurostar can claim that travelling to Paris on their trains
is ten times less polluting than travelling by plane.
Problems in the Estimates
Calculating the appropriate figure of CO2 produced
by different forms of transport is not a precise matter.
However, the differences between modes of transport are so great that
a reasonable estimate is sufficient to inform one's actions. The difficulties
in assessment include:
- Estimating the pollution caused in creating the vehicle. Not only is this difficult to calculate,
but also its impact depends on the distance that might be travelled by the vehicle in its life.
For these reasons it is ignored in this assessment.
- The actual fuel consumption performance of the vehicle.
The basic data is not widely publicised for public service vehicles.
It does not seem to have been considered very important until recently.
- The journey characteristics, such as the way the vehicle is driven
and the amount of braking, acceleration and hill climbing.
Bus and train routes with frequent stops require more energy per mile than the same vehicle travelling at a constant speed.
The same is true of cars in city rush hours when compared with cars travelling a reasonable speed on the open road.
- The CO2 generated for each unit of energy used.
Where a vehicle uses a fuel such as diesel this can be calculated
fairly accurately, but for electric vehicles it depends on the source of the
electricity used. With the current mix of power stations in the UK an average
figure of 410 g/kWh can be calculated, though some references use 450 g/kWh.
A report on the London Underground uses the figure of 523 g/kWh, possibly
because some of the pollution comes from the road vehicles used. Electric
trains in France assume very low figures as most of the power is expected to
come from nuclear power stations.
- The number of people travelling in the vehicle, as the CO2 produced
is not greatly affected by additional passengers.
For cars we assume an average of 1.5 people per car, which is approximately the national average,
but will not be the same for all models of car.
For public transport the figures vary widely.
A fast link by plane or train between two large centres of population may be
able to achieve a loading of 50–80%, while a link from a major conurbation to much smaller towns, such as the route to the west from Paddington,
is unlikely to achieve more than 40% overall without great overcrowding in the stages closest to the hub.
Suburban routes need to provide a reasonable service throughout the day, but
typically have a peak usage around rush hour. As a result they are expected
to achieve an average occupancy of not more than 30%.
Rural buses often run with very few passengers.
Rural taxis often do half their travel without passengers.
Top of Page
Estimates for two-wheeled vehicles
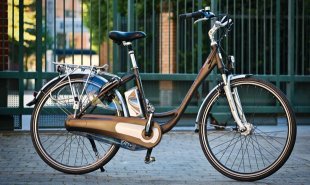
- A typical electric bike,e.g. the Kalkoff, has
a battery storing 260 Wh and a quoted range of 26–50 miles.
We might assume 130 miles/kWh on the road, however there is a waste of energy
in charging and discharging a battery leading to an overall figure of 100 miles/kWh
from the mains plug. In the future, electric bikes may incorporate regenerative
braking to recharge the battery when going downhill or stopping.
There is a thorough description of electric bikes in the book
"Electric Bicycles" by David Henshaw & Richard Peace. An outline is in their
web site electricbicyclesbook.com.
- Scooters typically have small fairly
inefficient engines, and so a 50 cc scooter may only achieve 100 mpg,
not much better than a small car.
- Motorbikes are not subject to statutory
consumption tests and consumption depends strongly on how the bike is used.
The figures quoted are typical of those reported. A large and powerful bike
may return 50 mpg, while bikes with engines below 250 cc may achieve 35–55
km/litre (100–150 mpg).
Estimates for cars
For cars the results used are derived from official figures
from the
Vehicle Certification
Agency.
These are derived from the average of standard urban and rural cycle consumption
tests. The mpg reported from general use on the road is normally
significantly lower than the published test results.
- Small cars – performance figures for
both petrol and diesel powered cars are led by small cars with small engines.
- Hybrid cars attempt to reduce
consumption by storing energy in a battery when slowing down or going downhill
and then using the battery to boost acceleration or performance going up-hill.
The drive systems can also be designed to allow the engine to be run fairly
continuously at the speed giving maximum efficiency. The third generation Toyota
Prius launched in August 2009 is a family-sized vehicle for which the manufacturer
claims a consumption figure of 26 km/litre (72 mpg). This is 20% better than
that of the first version, and competitive with smaller conventional cars.
- Diesel cars – though diesels generate
about 11% more CO2 per gallon than petrol engined cars,
they may get 30% more mpg. Thus the diesel version of a car typically generates
less CO2 emissions than its petrol equivalent.
- Electric cars have the advantage in
cities that they produce no pollution while being driven.
A major drawback of electric cars is that they need to be connected to the mains
electricity for time-consuming recharges at regular intervals. A gallon of
petrol contains about 40 kWh of energy. An electric car should get the same
performance from say 15 kWh of mains electricity, as electric motors are more
efficient than petrol ones. The relative cost of electricity and petrol is
roughly equivalent unless the electricity can be taken using a low-cost night-time
tariff. However, this will take over four hours to supply using a 13 amp 240
volt connection. On long journeys the wait at a service station could give
plenty of time for holiday reading. It will be a long time before it is possible
to exchange batteries at a service station.
- Rural taxi service is assumed to use
Mercedes E220 automatic cars and to run 50% of its mileage without passengers.
Estimates for buses and coaches
- A coach is assumed to achieve 10 mpg,
as mentioned in several documents. Occupancy of 60% is claimed by
National Express.
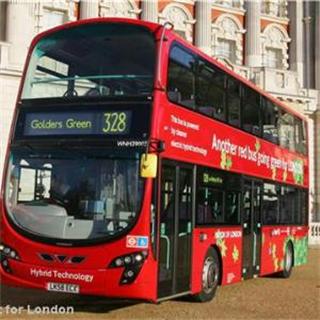
- The Department of Transport gives a typical figure for European
diesel city buses
as 55 litres/100 km (about 5 mpg). Many towns and cities are starting
to use diesel hybrid buses (photo) with somewhat better fuel consumption.
- Rural bus figures are not easy to find.
This estimate assumes 10 mpg, as buses are smaller than coaches but stop
more frequently. The average number of passengers is a very variable figure,
and the choice of five is an optimistic assumption
based on observation of the Blewbury buses.
Estimates for trains
The consumption by trains is increased by inclines, and by frequent stops.
On comparable services, high speed trains require more energy than slower ones because of
the greater air resistance at high speed.
- The grams CO2 per mile for the London
Underground comes from
Transport for London's London Underground Environmental Report 2007. It
covers all electricity used by the underground, including escalators and
their road vehicles. They reported 68.9 grams CO2/passenger-km.
- IC225 electric trains from London to Edinburgh
are quoted in a Department of Transport press release as requiring 0.035
kWh per seat-km. The next generation being ordered is to achieve 0.030 kWh
per seat-km.
- The Commission for Integrated Transport
produced a report claiming that high-speed diesel trains generate twice
the CO2 of
IC225 electric trains. The diesel trains through Didcot are on a line that
cannot achieve the loading of the IC225 routes.
- A suggested new 300 kilometre per hour high-speed
train might require about
50% more energy than the IC225 it replaced. This might require 0.045 kWh
per seat-km. French TGV and German ICE trains are reported as requiring
about 20 and 25 kWh per km, which is comparable. The CO2 emissions
is based on the 410 g/kWh used elsewhere for electricity in the UK.
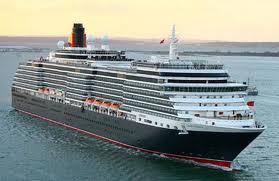
Estimates for cruise liners
Statistics on the recently built Queen Victoria
cruise ship state
that when the engines are producing maximum power
it will be using about 10 tonnes per hour of fuel oil and achieve 23.7 knots.
The stated cruising speed is 18 knots (20.3 miles/hr)
To a first approximation water resistance changes by the cube of the speed,
thus normal consumption may be 4.38 tonnes/hr. As a tonne is 1000 kg,
the density of fuel oil is about 0.89 and there are 4.545 litres in a gallon
this corresponds to 1083 gallons/hr or 0.019 mpg.
A higher figure of 0.025 mpg is assumed as the ship will not be travelling
at the cruising speed all the time.
Estimates for planes
|
- The huge Airbus A380 has a range of 15,200 km
(9268 miles) and can carry 310,000 litres (68,207 gallons) of aviation fuel.
This indicates a minimum of 0.135 mpg. As the plane must have a reserve
for emergencies 0.18 mpg is assumed. A 70% occupancy is also assumed.
Aircraft emissions at high altitude are said to be 2 to 5 times more serious than the raw CO2 figures.
- In a press release in Sept 2006 Ryanair claimed to achieve 3.3 litres/100
passenger-km with its smaller Boeing 737, and
also stated that other airlines were less efficient. The figure used is 40%
worse than that claimed by Ryanair. For short journeys the multiplier for high-altitude
travel should be less than for long journeys as less of the flight will be
at high altitude. However, journeys to and from airports are often by private
car, and these can add more pollution than the whole of a short flight.
|
Top of Page
|